New gTLD Infographic: 2016 Year in Review
The New gTLD Infographic – 2016 Year in Review
New gTLD Infographic
As posted on CircleId on January 5, 2007.
The data analyzed within the New gTLD Infographic – 2016 Year in Review is based on the following:
- New Top Level Domains (TLDs) contained in the data set reflect open TLDs and exclude single registrants such as brands
- For greater insight, TLDs have been separated into four quartiles or ‘tiers’ with tier 1 being the top 25% and tier 4 being the bottom 25%
- Initial registration upswings have been eliminated with TLDs in the data set to be in General Availability for at least 60 days
- Top ten based on projected yearly revenues based on daily registration volumes
- Registry revenues do not include premium name sales as dependable revenues are not available
- Operational losses are based on TLD revenues with a conservative $150k in expenses
- Revenues are based on the average retail price over four registrars (101Domain, eNom, GoDaddy and United Domains) in December 2016
- If significantly low registration pricing (less than $5) was employed on an extended or repetitive basis, the lowest price was used. This is a change from prior New gTLD Infographics comparisons where the TLD was removed from the data set.
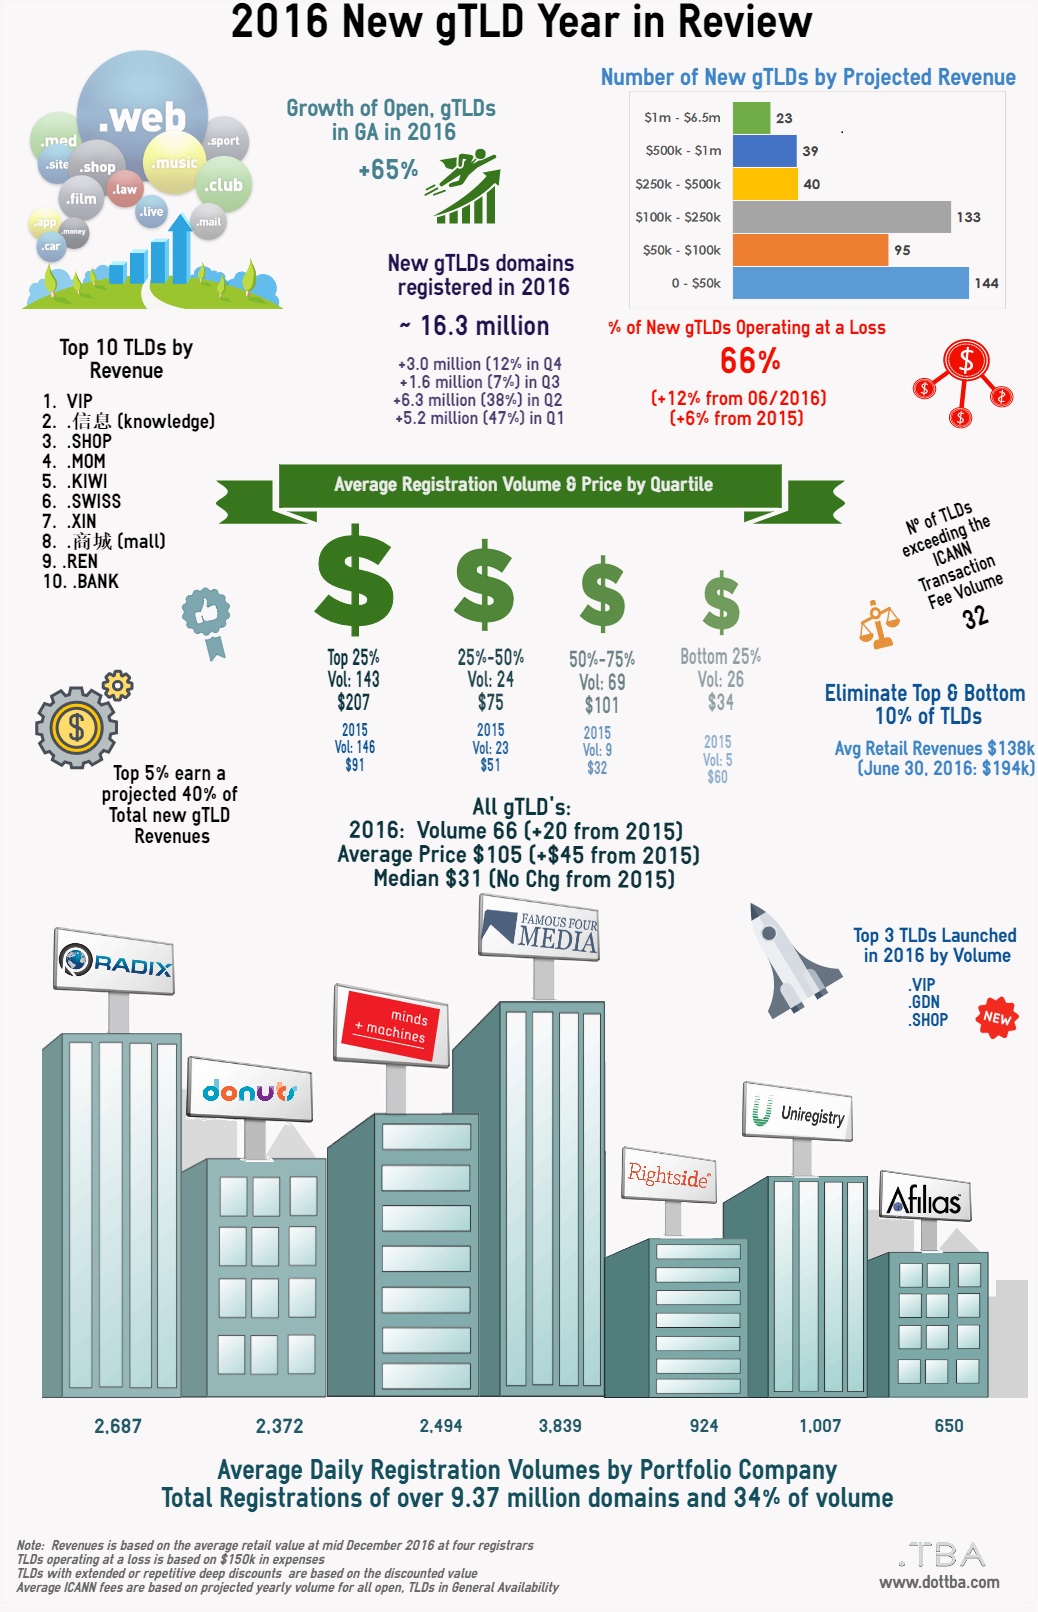
Top Level Domain Statistics and Business Implications 2016 Overview
- New gTLD Infographic: 2016 Year in Review dataset analyzed contains 475 TLDs that were in general availability for at least 60 days (an increase of 63 over 2015)
- Average number of registrations per day is 66
- Top 25 TLDs account for 40% revenues and 12% of registration volumes (significant change from 2015 with half of revenues accounting for half of the registration volume)
- Less than 4% of TLDs will exceed ICANN’s minimum yearly fee
- Largest group of TLDs are in the $20 – $25 retail price range followed by the $25 – $30
- Average revenue of all gTLDs is $252k
- Average retail prices vary ($34.14 to $206.70) within each tier differ yet the median price variance is less significant ($28.49 to $33.74)
- All tiers have a ‘very weak’ correlation between price and volume
- Based on today’s data, 66% of TLDs are projected to operate at a loss for the next year based on conservative, yearly expenses of $150k; with over 400 TLDs belonging to portfolio companies, the percentage decreases
2016 Insights from gTLD Statistics and Business Implications by Quartile
Tier 1: Trailblazers – Leading TLDs with a consistent gap over the other three tiers based on higher prices and consistent volume
- Average retail price of $207 (increase from $91 in 2015) and a median of $32.99 (decrease from $35 in 2015 but lower than tier 3 of $33.74)
- 5 out of 10 of the highest average retail priced TLDs are in tier 1 (.auto, .car, .cars, .security, .protection)
- 70% of TLDs in tier 1 in 2015 remain in tier 1 in 2016; However, 51% had a reduction in their retail price on average $12.47 with a median of $3.72 resulting in an average registration volume increase of 48 but with a mean volume decline of 15
- Projected yearly volume remains relatively unchanged with a small decrease of 2.2% over 2015
- 34% and 42% of TLDs that went into General Availability in 2015 and 2014 respectively are in tier 1
- Average TLD length is up to 5.45 characters in length
- Deeply discounted TLDs in tier 1 include .loan, .online, .site, .gdn, .bid, .tech
- Tier 1 TLDs include: .vip, .shop, .mom, .bank, .design, .nyc, .games, .city, .lawyer
- More precise pricing needs to be tracked to provide comparable yearly revenue projections and analysis
Tier 2: Path Finders – Finding their Way
- Average retail price jumped from $51 in 2015 to $75 in 2016; However, the median price had a small increase moving from $29.99 to $30.49
- 67% of TLDs in tier 2 in 2015 remain in tier 2 in 2016; However, 31% had a reduction in their retail price on average $1.82 with a median decrease of $8.09 resulting in an average registration volume decrease of 1 but with a median decrease of 8
- 32% and 64% of TLDs that went into General Availability in 2015 and 2014 respectively are in tier 2
- Average TLD length is up to 6.05 characters in length
- Average volume in 2016 increased just over 4.1% to 8,728 from 8,387 in 2015
- Tier 2 TLDs include:.gift, .racing, .video, .taxi, ,bar, .earth are in the second tier of gTLDs
Tier 3: Campers – Niche groups of TLDs
- Average retail price in tier 3 is $101.27 and a median price of $33.74
- 67% of TLDs in tier 3 in 2015 remain in tier 3 in 2016; However, 26% had an increase in their retail price on average $3.67 with a median reduction of $4.07 resulting in an average registration volume increase of 2 but with a median decrease of 3
- 21% and 71% of TLDs that went into General Availability in 2015 and 2014 respectively are in tier 3
- Average TLD length is up to 6.38 characters in length
- Tier 3 TLDs include: .estate, .holiday, .codes, .cards, .soccer, .accountants, .toys
Tier 4: Hikers – Determining a pathway up!
- Lowest pricing amongst all tiers with an average retail price of $34.14 (up from $31.62 in 2015) and a median price of $28.49 (down from $28.74 in 2015)
- 80% of TLDs in tier 4 in 2015 remain in tier 4 in 2016; However, 29% had an increase in their retail price on average $4.92 with a median reduction of $2.35 resulting in an average and median registration volume decrease of 2
- Projected volume has grown due to TLDs who have offered significant discounts but with total revenues remaining in tier 4
- 20% and 75% of TLDs that went into General Availability in 2015 and 2014 respectively are in tier 4
- Average TLD length is up to 6.29 characters in length
- Tier 4 TLDs include: .joburg, .cologne, .florist, .actor, .supply, .gripe, .sarl
gTLD Business Implications for 2017
- As the number of new TLD delegations tapers off, 2017 will be interesting as the industry shifts focus from launches to operations will play a bigger role. As such, TLDs rising to tier 1 at the end of the year will likely be diverse from prior years
- Average registration volumes have increased to 23,900 an average increase of 5,650 over 2015
- Number of TLDs offering deeply discounted registrations has also increased
- As reflected in the New gTLD Infographic, average retail prices have increased by $45 over 2015 with almost no change in the median price ($-.038)
- Top 5% of TLDs account for 40% of all projected revenues
- In 77% of all cases, the singular TLDs ranks higher than the plural TLD i.e. .loan/.loans, .game/.games, .accountant/.accountants
- Volume of IDNs in tier 1 have increased to 37% (up from 26% in 2015), tier 2 and tier 3 each have 15% (tier 2 down from 22% in 2015 and tier 3 up 11%). Tier 4 remains unchanged with 48%
- Premium name revenues have not been taken into account which can have significant impacts on the financial performance of a TLD
Please do not hesitate to contact us for any questions, insight or items to consider for future New gTLD Infographic analysis.
 Previous Post
 Next Post